Topic Modelling
Photo credits: Great Learning
2nd July 2020
Topic modelling is fundamentally an 'unsupervised' machine learning technique that involves extracting key themes or concepts from a corpus of documents into distinct topics. A set of documents are sorted and automatically clustered based on the word groupings that best characterise them. These word groupings signify a specific topic, theme or concept that can be used to describe the documents.
At the beginning of this year, I had zero experience with solving natural language processing (NLP) problems. Hence, I made it a priority for me to learn to solve text classification, sentiment analysis and topic modelling problems. So, I want to give a very high-level breakdown of how I have learnt to solve a topic modelling problem. For this example, I’m going to find the topic models for newspaper articles and the code can be found here.
Text Wrangling: Making a Corpus and Dictionary
Preparing the data is often the most time-consuming task for any machine learning project. When dealing with unstructured data like text data, it is important to process the data into a more structured format that reveal their underlying patterns for our machine learning models.
For text data, this often involves:
- Lowering the cases and removing accents from words
- Tokenization – splitting the text sample into individual words.
- Lemmatization – reduce the form of a word to its common base form (e.g. car -> cars, meeting -> meet, etc.)
- Removing infrequent words (e.g. words that only appear once)
- Removing stop words (words commonly used in the English language, e.g. ‘the’, ‘a’, ‘an’, ‘in’, etc.)
Before running this through a topic modelling model, a dictionary with the unique terms/phrases with its number mappings needs to be made (since machine learning models only work with numeric tensors). Here is an example one stage building the dictionary or words and phrases (bigrams in this case):

Latent Dirichlet Allocation(LDA)
LDA is a common technique used for topic modelling that can be implemented with packages such as Gensim, Mallet or even SciKit-Learn. The math behind this technique is pretty complicated, so I’m not going to run over this here. For those interested, click here. LDA effectively generates a probablisitc model builds topics based on the words embeddings in the documents and assigns topics to each document depending on their relevance. The steps can be summarised below:
- Initialise the necessary parameters (e.g. number of topics to find, iterations and dictionary to use) and introduce the processed text documents.
- Each word within each document is randomly initialised to one of the K topics.
- Start the following iterative process and repeat it several times. For each document D, for each word W in
document, and for each topic T:
- Compute P(T| D), which is proportion of words in D assigned to topic T.
- Compute P(W| T), which is proportion of assignments to topic T over all documents having the word W.
- Reassign word W with topic T with probability P(T| D) × P(W| T), considering all other words and their topic assignments.
After running several iterations, you should have N distinct topics with associated terms for your data. Of course, how accurate these topics describe your documents depends on the model and the data being processed.
Testing Metrics and Fine Tuning
As topic models are unsupervised techniques trained on unlabelled data it is difficult to measure the quality of the results. However, a useful metric seems to be used in the literature is "topic coherence". Topic coherence is also another complex topic that I won’t cover here, if you’re interested, click here. Just know that the higher the coherence the better our model is.
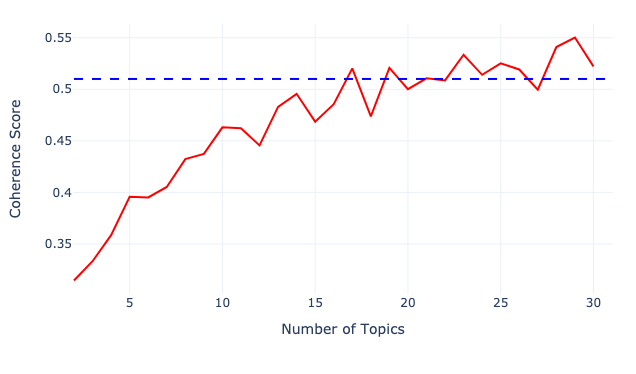
So, the question is can we find the optimal number of topics that maximises the coherence? The number of topics entered into an LDA model is like a hyperparameter that has to be set before training. Thus, we can build several LDA models with varying number of topics and select the one that has the most reasonable coherence score.
Evaluating Results and Visualising Topic Models
There are many ways that you can evaluate the results, but I'll only show a few options. First, you have to select an appropriate number of topics for a model. Looking at the graph above, you can see that the coherence score starts to taper off around 20-22, so let’s select 20 as this seems like a sensible number of topics for 50,000 different news articles. Of course, the coherence is very high for 29, but it wouldn't be quite as informative to have 30 different topics.
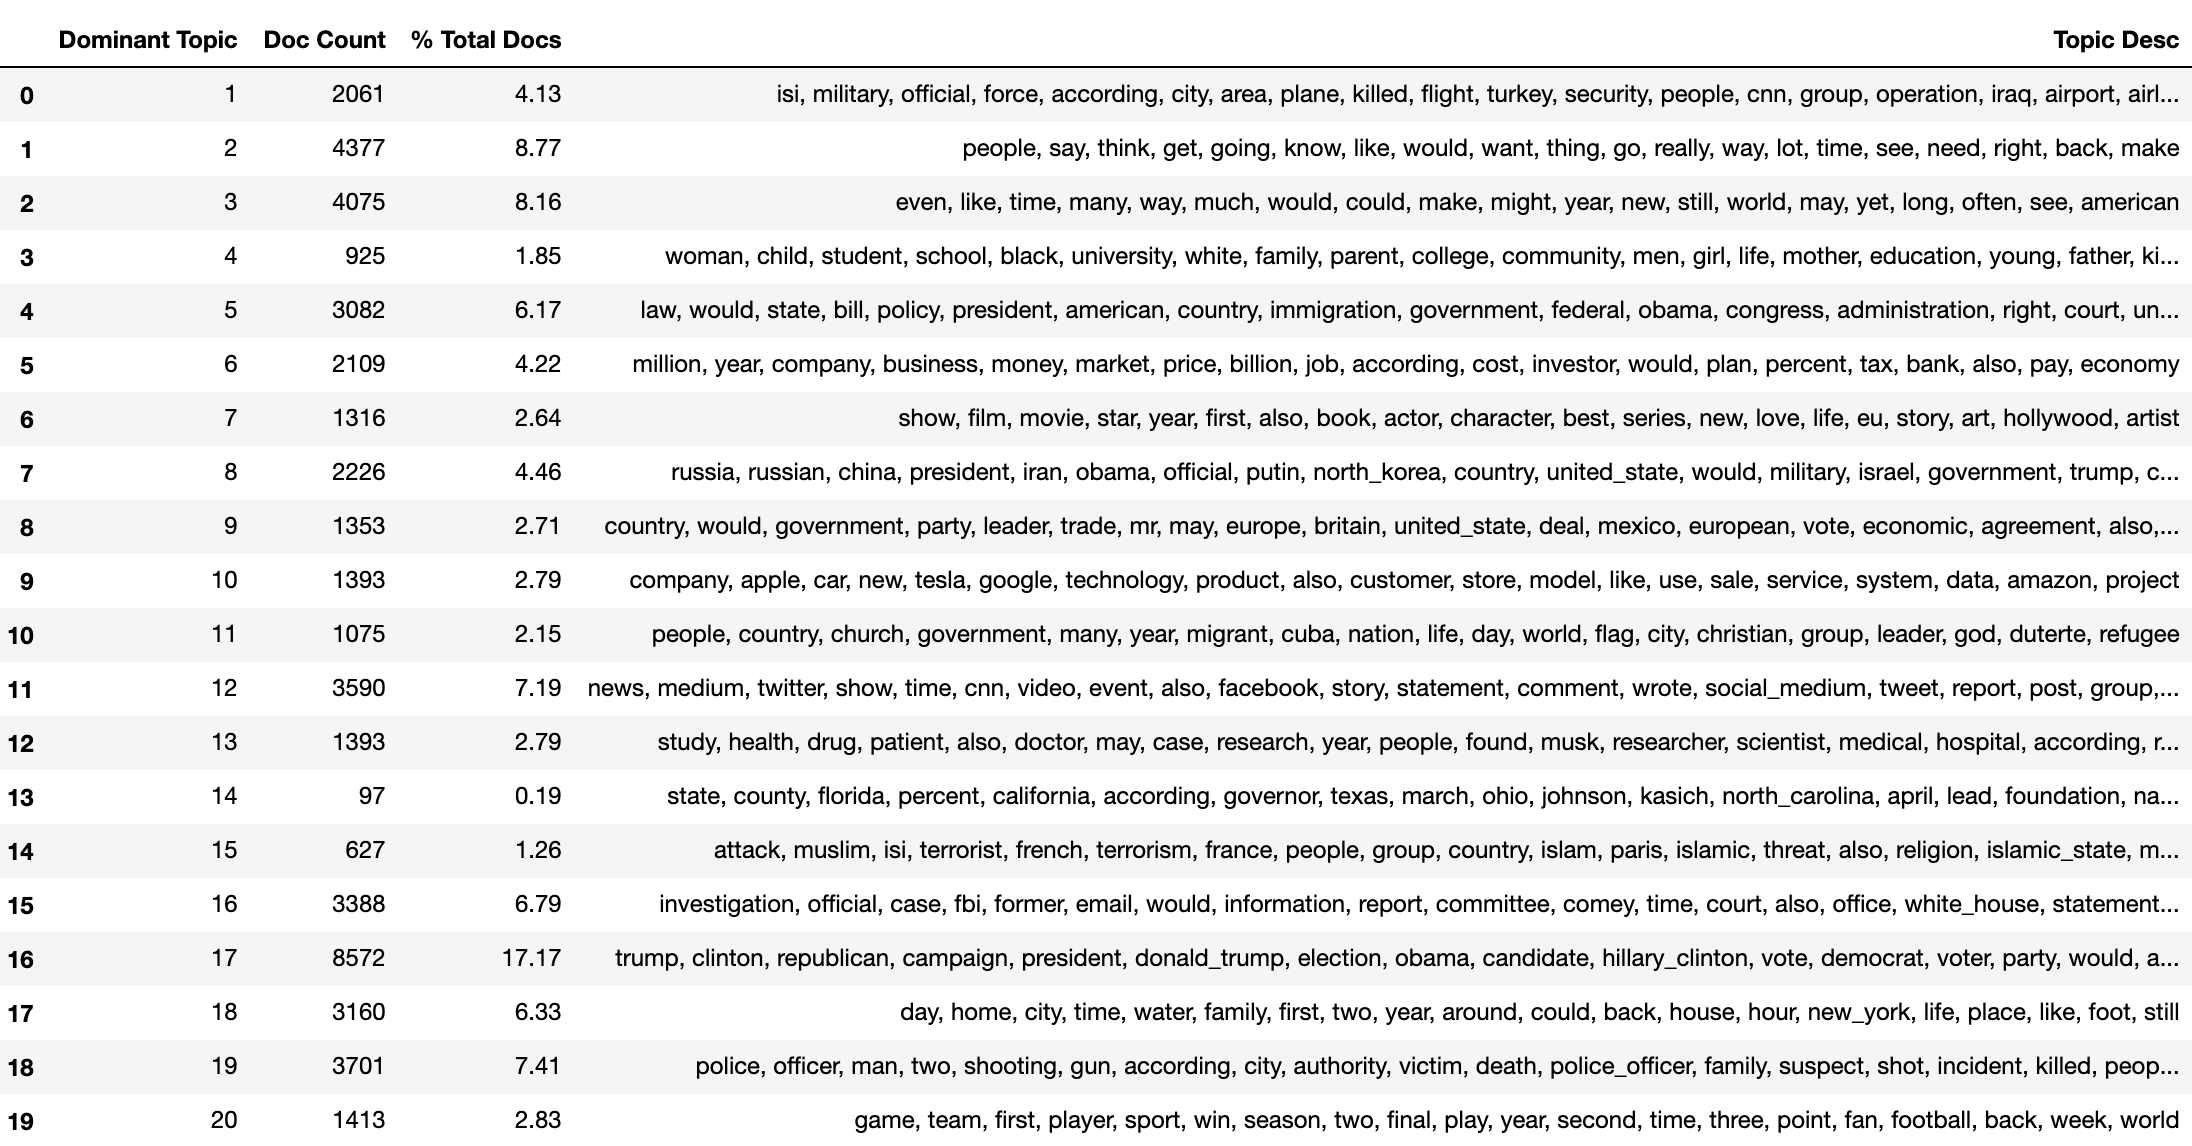
See below for the terms related to each generated topic. Many of the topics are related to politics, global conlict and a few topics about daily life and sports events. But some of the topics are not very helpful at all, e.g. Topic 2 and 3. But generally, the topic models looks reasonable to me.
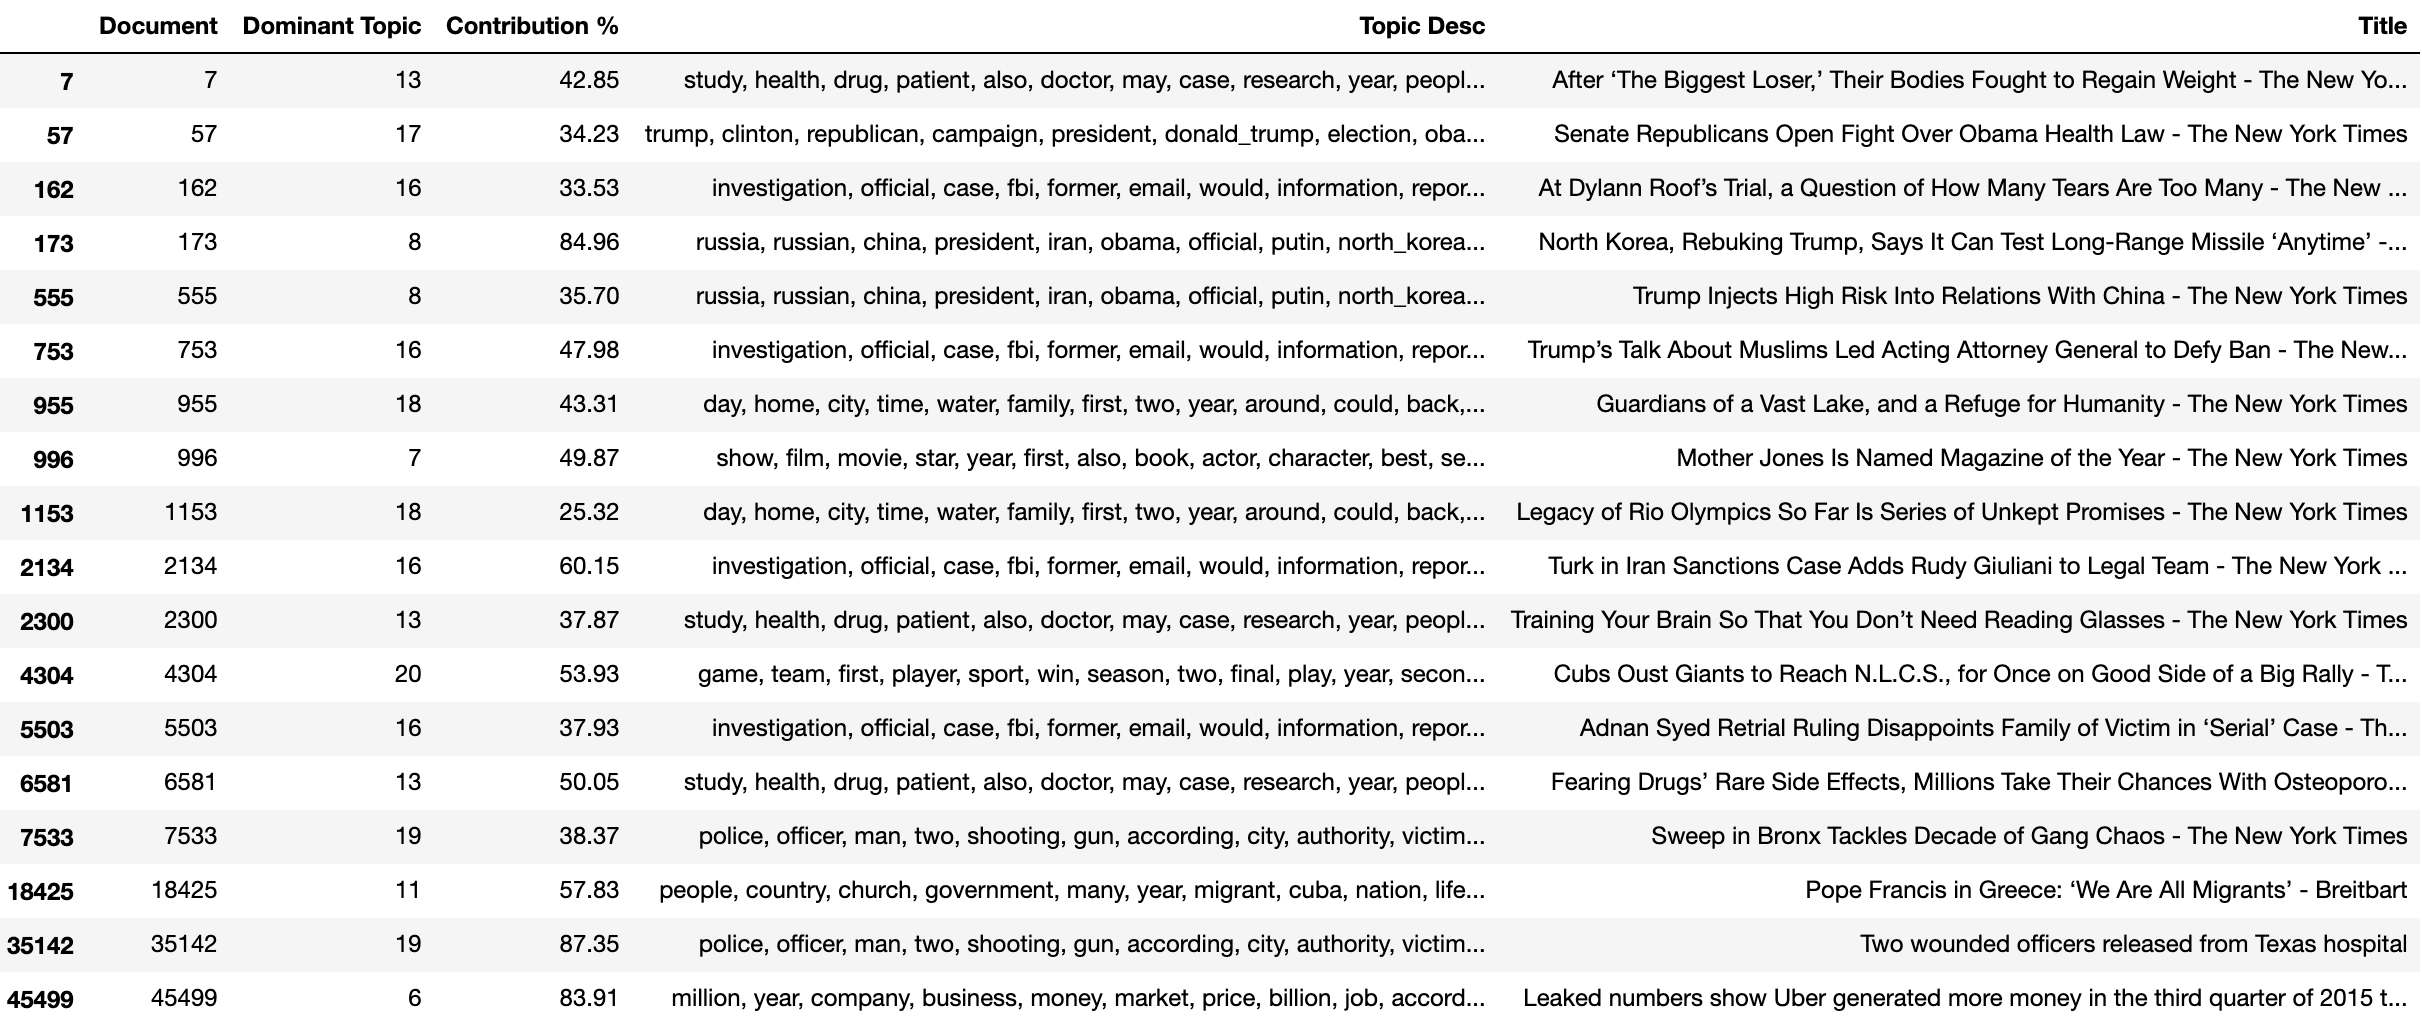
Below I've selected the some random papers (out of the 50,000 available) to see how the model identifies it with its dervied topics. As you can see, the newspaper titles and descriptions seem to match up pretty well for the derived topics.
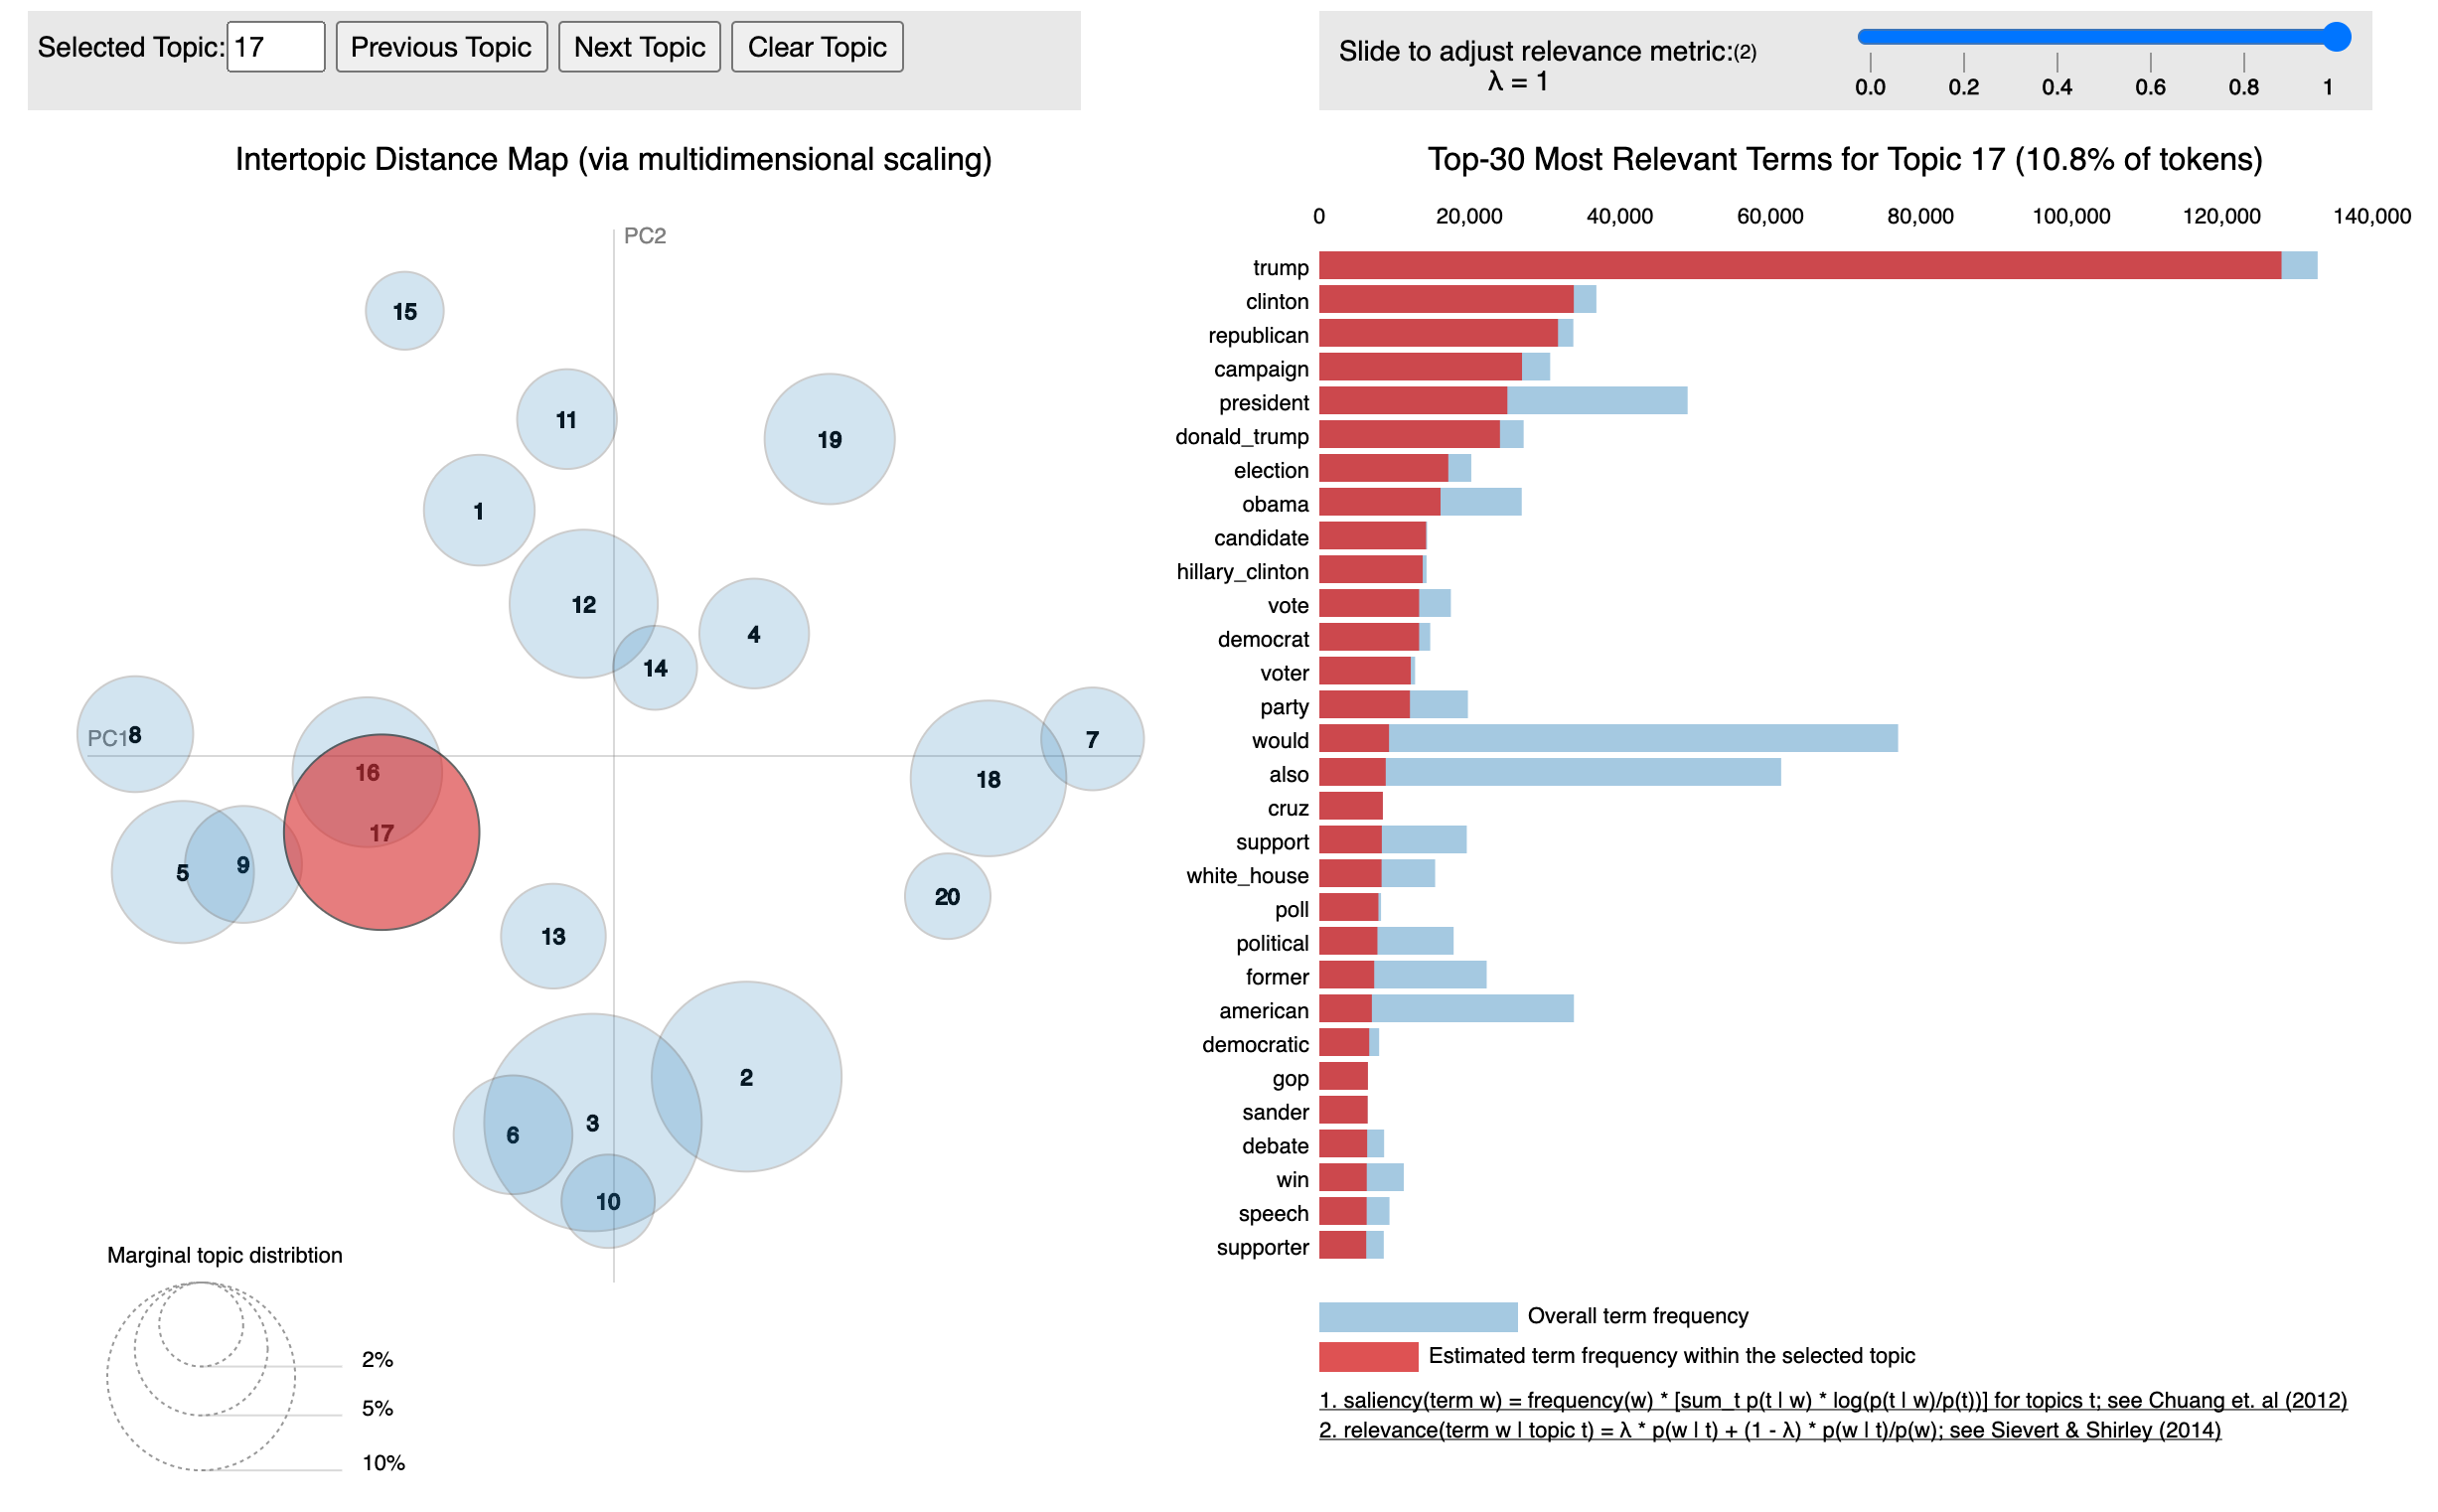
The pyLDAvis package can be used to interpret the topics. The package extracts information from a fitted LDA topic model to inform an interactive web-based visualization. This is a really interesting way to see the clustering of the topics. The size of the bubble measures the importance of the topics, relative to the data.
Conclusion
Well, that’s what I’ve managed to work out. Of course, you can use your LDA model to predict topics of new newspaper articles (I've done this in my code in GitHub but chosen not to show it here). There are definitely ways that this can be improved, something for me to work on another time.